Fichier:Methallyl carbinol.png
Révision datée du 16 avril 2013 à 13:28 par Mackeprang (discussion | contributions) (The left side of the figure shows the NCI plot of the reduced density gradient versus the electron density multiplied by the sign of λ_2 for the most abundant conformer of methallyl carbinol (top) and allyl carbinol (bottom). The right side of the figure)

Taille de cet aperçu : 788 × 600 pixels. Autres résolutions : 315 × 240 pixels | 2 196 × 1 672 pixels.
Fichier d’origine (2 196 × 1 672 pixels, taille du fichier : 215 kio, type MIME : image/png)
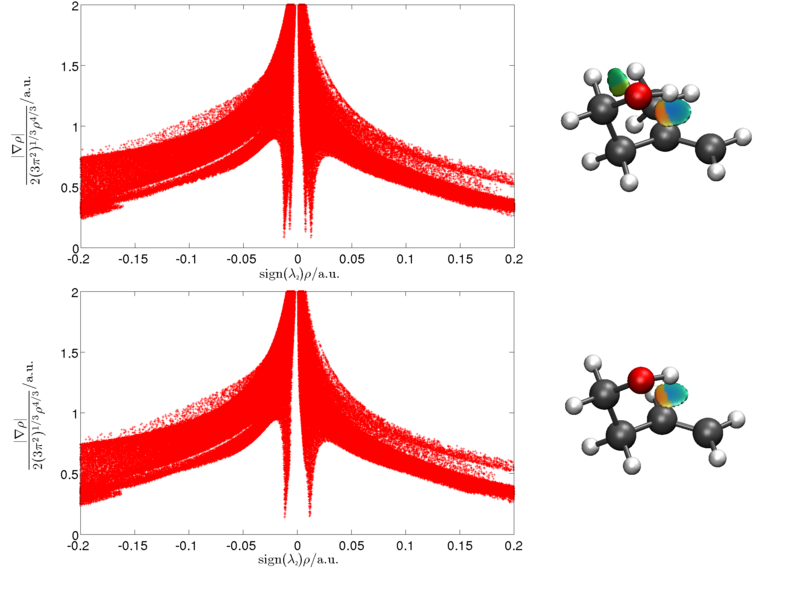
The left side of the figure shows the NCI plot of the reduced density gradient versus the electron density multiplied by the sign of λ_2 for the most abundant conformer of methallyl carbinol (top) and allyl carbinol (bottom). The right side of the figure shows the corresponding NCI isosurface generated for s=0.5 a.u. The color of the isosurface depends on the value of sign(λ_2)ρ, which ranges from -0.02 to +0.02 a.u. The isosurface is blue if sign(λ_2)ρ, green if sign(λ_2)ρ is close to 0 and red if sign(λ_2)ρ
Historique du fichier
Cliquer sur une date et heure pour voir le fichier tel qu'il était à ce moment-là.
| Date et heure | Vignette | Dimensions | Utilisateur | Commentaire | |
|---|---|---|---|---|---|
| actuel | 16 avril 2013 à 13:28 |  | 2 196 × 1 672 (215 kio) | Mackeprang (discussion | contributions) | The left side of the figure shows the NCI plot of the reduced density gradient versus the electron density multiplied by the sign of λ_2 for the most abundant conformer of methallyl carbinol (top) and allyl carbinol (bottom). The right side of the figure |
Utilisation du fichier
La page suivante utilise ce fichier :